Custom QuickBooks Reports
Custom Excel Charts
Interactive Pivot Tables
QuickBooks Custom Reporting
When you just need an Excel flat file
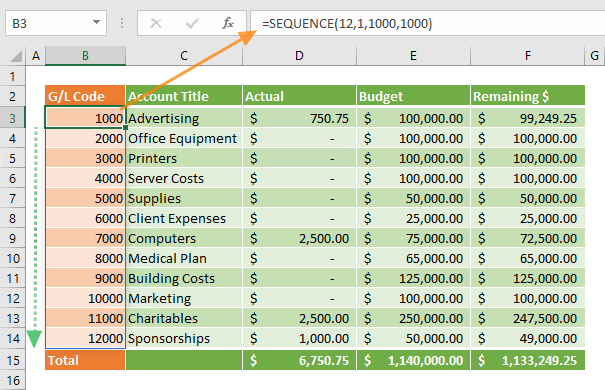
Automate Pivot Table creation instead of manually loading Quickbooks’ default CSV export each time you are looking to do further analysis. Avoid Quickbooks’ default formatting and get just the data you need, quickly.
When Quickbooks' Customize Report feature is not enough
Quickbooks’ built-in “Customize Report” feature is a good start for built-in reports, but sometimes you want what QB doesn’t offer, or an associate is in a different report. We can build that for you using the fields and hierarchy you define.
Connect to Quickbooks data in real time
You’re limited by Quickbooks’ processing power and having to call up various reports (even if you memorized them) is time consuming. What if you could tap into the SQL database to grab only the data fields you want?
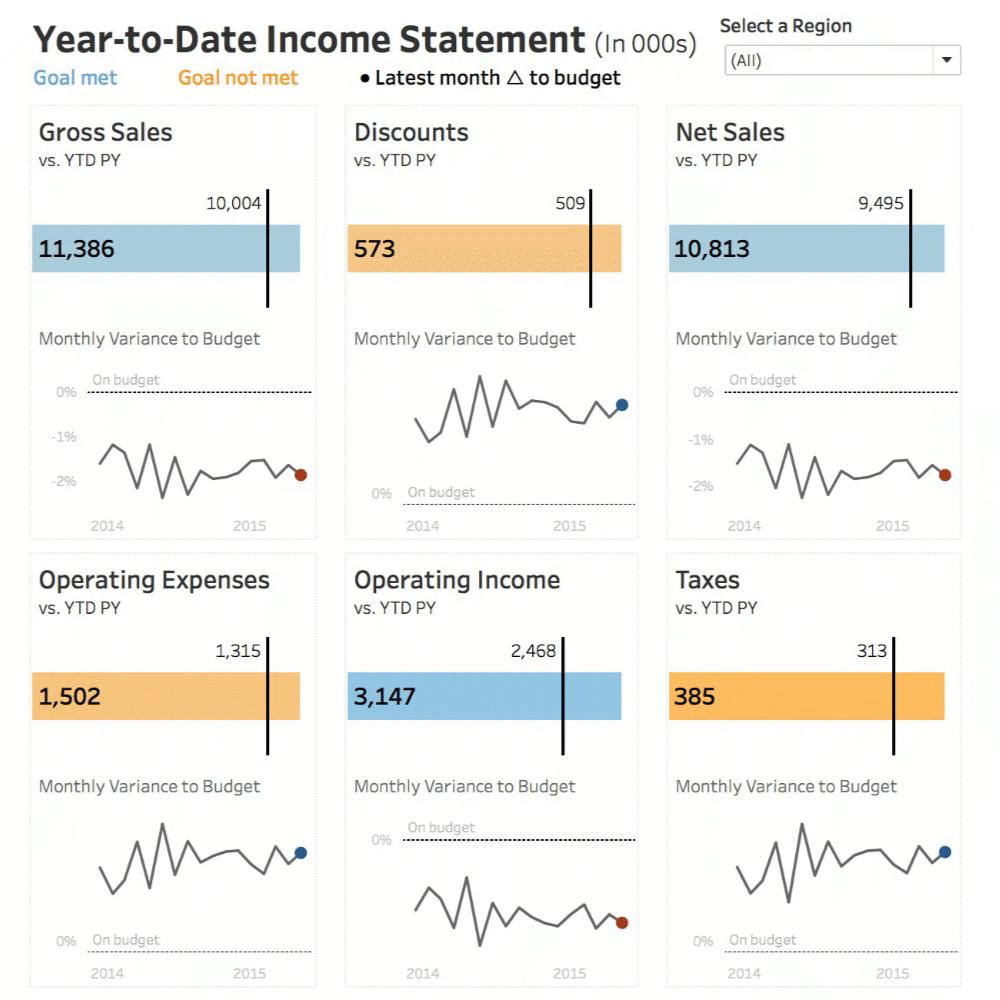
A dashboard without breaking the bank
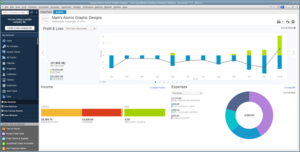
When the built-in graphical reports in Quickbooks is not enough. You want more of your KPI’s in one panel or there are KPI’s it doesn’t calculate for you.
Sample Custom Quickbooks Reports
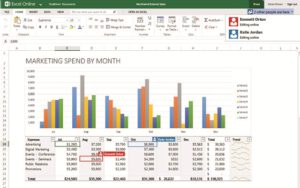
Profit and Loss YTD Comparison
Go beyond QuickBook’s standard reporting and compare performance by year over year for time periods you define – YTD, up to the last month, and over several years – automatically.
Reports by Class
P&L reports by class allow you to keep an eye on each segment of your business. Get P&L, expenses, transactions and balances by class or groups of classes.
Report by Expense Category
Get expenses by category, exclude categories and customers or expense codes.
Report by Job Type
Report all jobs by customer, jobs in a specific date range, jobs by class and Profit & Loss by job, job creation date, or any other field you define.
Previous
Next